Long-term Index January 2018
- January 2018 was in the long-term comparison clearly too mild and wet with more wind and less sunshine
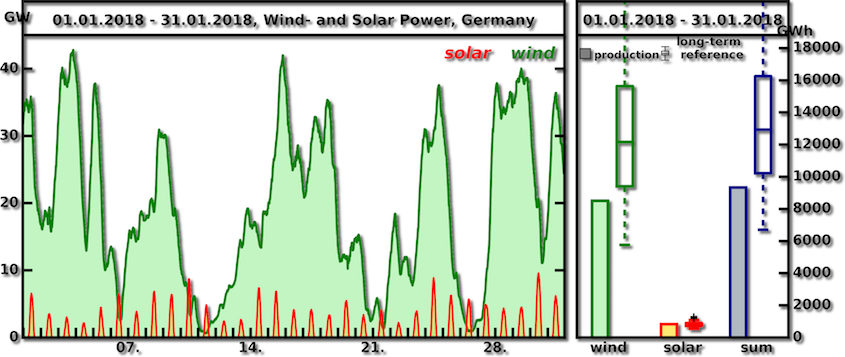
- Total production from wind and solar power with 14,443 GWh slightly above average
- Wind power with 13,744 GWh on rank 15, solar power with 699 GWh on rank 31
Karlsruhe, February 14, 2018. As in the months before, January 2018 was marked by frequent westerly weather conditions. Numerous low-pressure areas and their offshoots moved from west to east across Germany. It was clearly too mild and too wet with more wind and less sunshine compared to the long-term mean.
According to the UBIMET long-term index*, the wind power production in January 2018 is ranked 15th with 13,744 GWh. Decisive for the above-average rank were the windy weather due to many low-pressure areas and the two storm and hurricane depressions “Burglind” on 03.01. and “Frederike” on 18.01.The former was measured 217 km / h on Feldberg in the Black Forest. Such a high speed has not been measured in Germany for many years. The most profitable January of the last 40 years would have been the year 2007 with 21,218 GWh compared with the current Germany portfolio.
The solar power production in January 2018 is with 699 GWh of generated solar power among the 10 lowest in the last 40 years. On average, only about 50% to 80% of the sunshine target was achieved due to heavy rainfall. Only in the extreme south was the sunshine around or just over 100%. Thus, the January is the fourth month in a row with far too little sunshine compared to the long-term average. The best January for the solar power production would have been in 2006 with 1,290 GWh.
In total, 14,443 GWh of energy was generated by wind and solar farms last January. This is slightly above average compared to the last 40 years. The most profitable January for the total of wind and solar energy would have been in 2007 with 21,780 GWh.
* The long-term index makes the solar and wind power production yields in Germany comparable. Every month, the UBIMET experts calculate the respective yields of the last 39 years and compare them with the values of the current Germany portfolio. In the course of this, every yield is related to the currently installed capacity so that the periods can be compared.


